Real-time Query Analytics for MongoDB
MongoDB only
Real-time Query Analytics (RTA) currently supports MongoDB only. Support for MySQL and PostgreSQL is planned for future releases.
While Query Analytics (QAN) Stored metrics capture queries after they complete so you can analyze and optimize past performance, Real-time Query Analytics (RTA) displays queries as they execute. This allows you to identify problematic operations immediately and take action before they affect users.
RTA displays live query data, updated every 1-5 seconds. Data is held in memory only and refreshes with each update.
Use the Pause button to freeze the view for investigation.
Before you start
Service requirements
RTA requires at least one MongoDB service monitored by PMM. If you haven’t set this up yet, see Connect MongoDB to PMM.
RTA reuses your existing MongoDB exporter credentials, so you don’t need to configure anything else.
Role requirements
Starting and stopping RTA sessions requires the Admin role. Users with other roles have View-only access to sessions that an Admin has already started. For details on PMM roles, see Standard role permissions.
Start an RTA session
To start monitoring a MongoDB service:
- Go to Query Analytics in the sidebar.
- Select the Real-time tab.
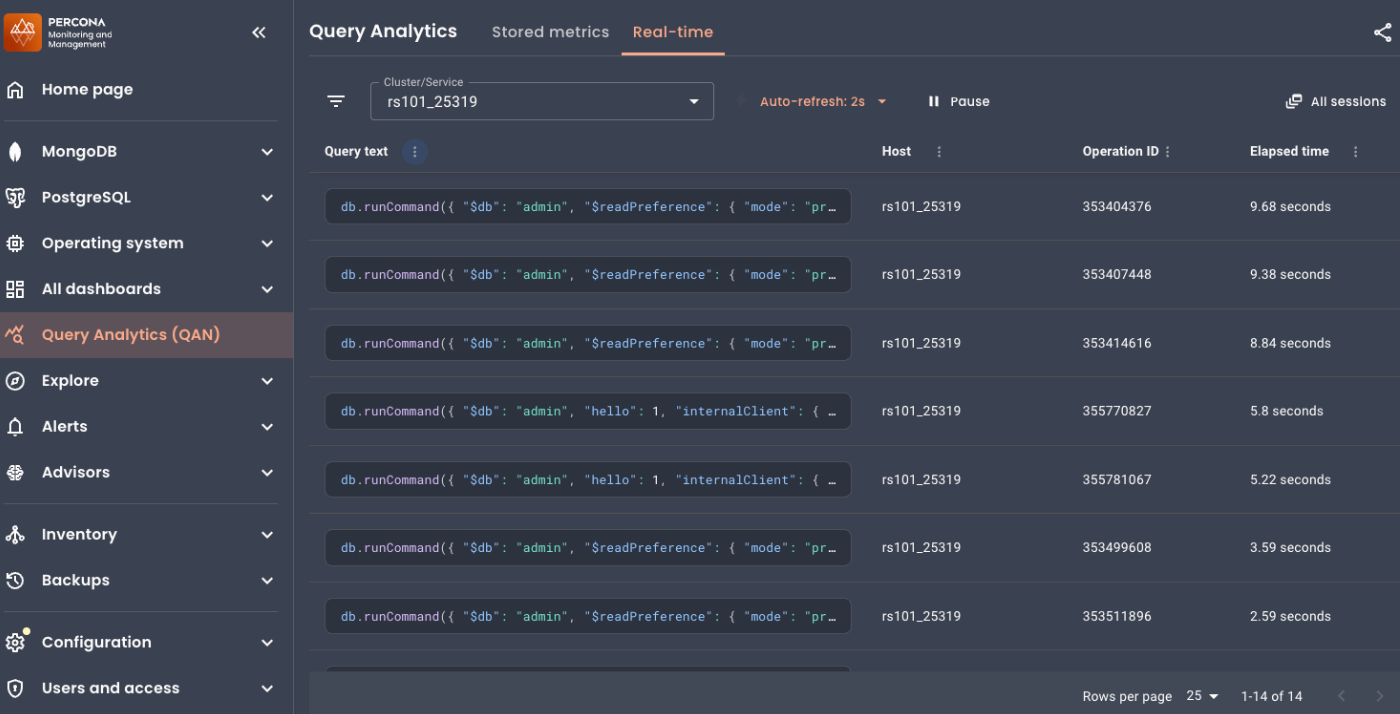
- If no sessions are active, select a MongoDB service from the dropdown and click Start session.
The live operations table appears and begins updating automatically:
Explore the Real-time view
Filter by service
If you have multiple MongoDB services registered, click + New session to run sessions simultaneously. This lets you monitor multiple replica set members at once or track several services during an incident.
Use the Cluster/Service drop-down to focus on specific MongoDB services. You can select multiple services to monitor activity across replica set members.
Control the refresh rate
Use the Auto-refresh drop-down to adjust how often the view updates. By default, RTA updates every 2 seconds, but you can set it anywhere from 1 to 5 seconds. Faster updates show more activity but add a small load to your database.
Pause the stream
Click Pause to freeze the current view. This lets you investigate a specific operation without it disappearing when the next refresh happens.
While paused, the display stops updating but the RTA agent continues collecting data in the background. Click Pause again to resume, or use Auto-refresh for a one-time update while staying paused.
Share your view
Click the Share icon to copy a link to your clipboard. The link preserves your selected cluster or service filter.
When someone opens your link, they see live data with your filters applied—not the exact operations you were viewing, since RTA data updates continuously.
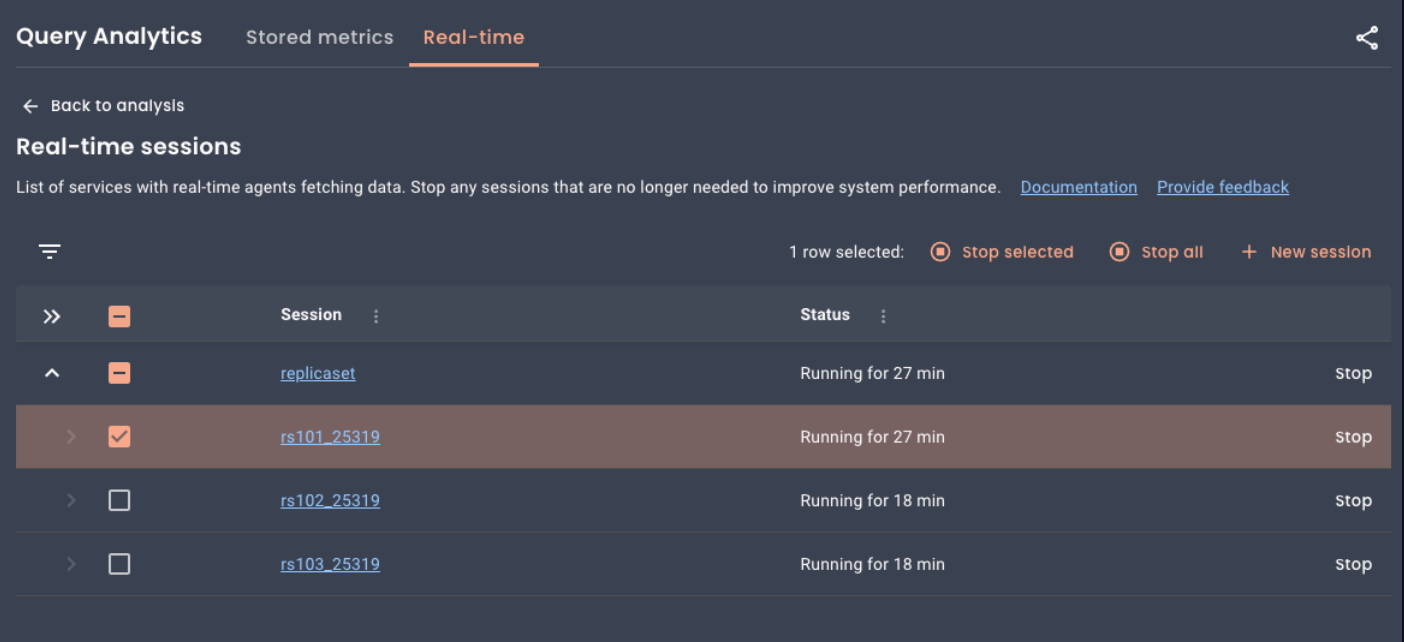
View all sessions
Click All sessions to see and manage all running RTA sessions. From here you can stop individual sessions or stop all sessions at once:
Monitor and investigate operations
Find slow operations
To identify operations that are taking too long:
- Click the Elapsed time column header to sort by duration, longest first.
-
Click an operation to open the Details tab, then check Plan summary for
COLLSCAN. This means the query scanned the entire collection—often a sign that an index is missing.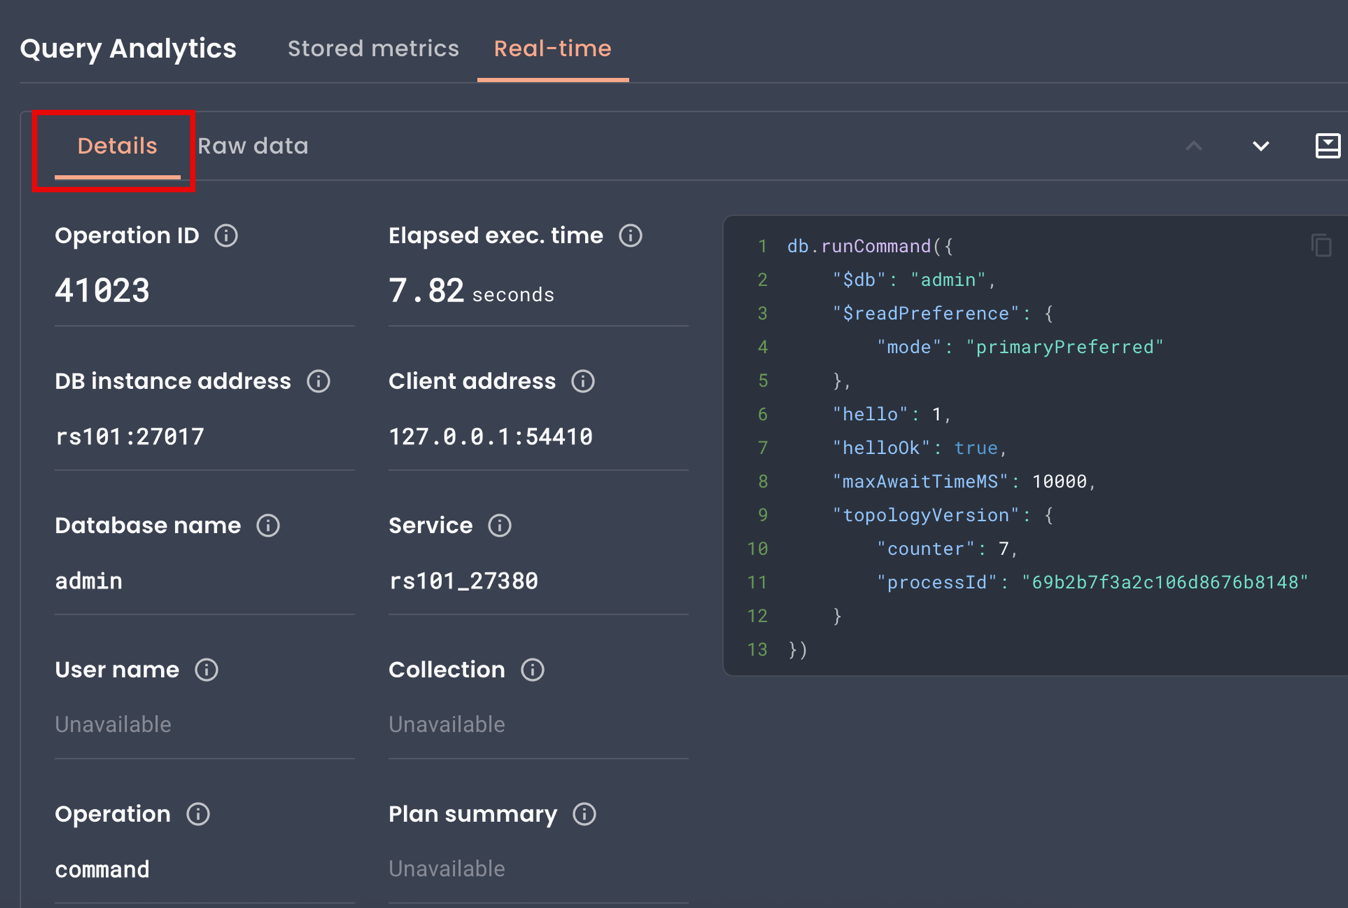
Repeated slow queries on the same collection often indicate it needs better indexing.
Trace an operation to its source
When you spot a problematic operation:
- Click the row to open the Details tab.
- Check Client app name, User name, and Client address to identify which application or server sent the query.
-
Check Database name and Collection to see which part of your database is affected.
If the same collection appears repeatedly in slow operations, it may be a hotspot that needs optimization.
Understand workload patterns
In the Details tab, check the Operation field to see what type of action the database is performing: query, insert, update, or command.
This helps you understand whether slow performance is caused by heavy writes, complex reads, or unexpected administrative commands.
Check for lock contention
If operations seem stuck, open the Raw data tab and look for:
waitingForLock: true: the operation is blocked waiting for a locklocks: shows which lock types the operation holds
Operations waiting for locks may indicate write contention or long-running operations blocking others.
Correlate with other events
Use the timestamps in the Details tab to connect slow operations with other events:
- Operation start time: when the database started executing this operation
- Data capture time: when PMM captured this snapshot
Compare these with deployment times, traffic spikes, or alerts to understand what triggered the problem.
Stop a problematic operation
Caution
Killing operations can leave data in an inconsistent state. Use carefully, especially for Write operations.
If you need to kill a long-running operation:
- Click the operation to open the Details tab.
- Copy the Operation ID value.
- Connect to your MongoDB instance and run:
db.killOp(<operation_id>)
View raw data
The Details tab shows a reconstructed version of the query, which may differ slightly from what you originally sent.
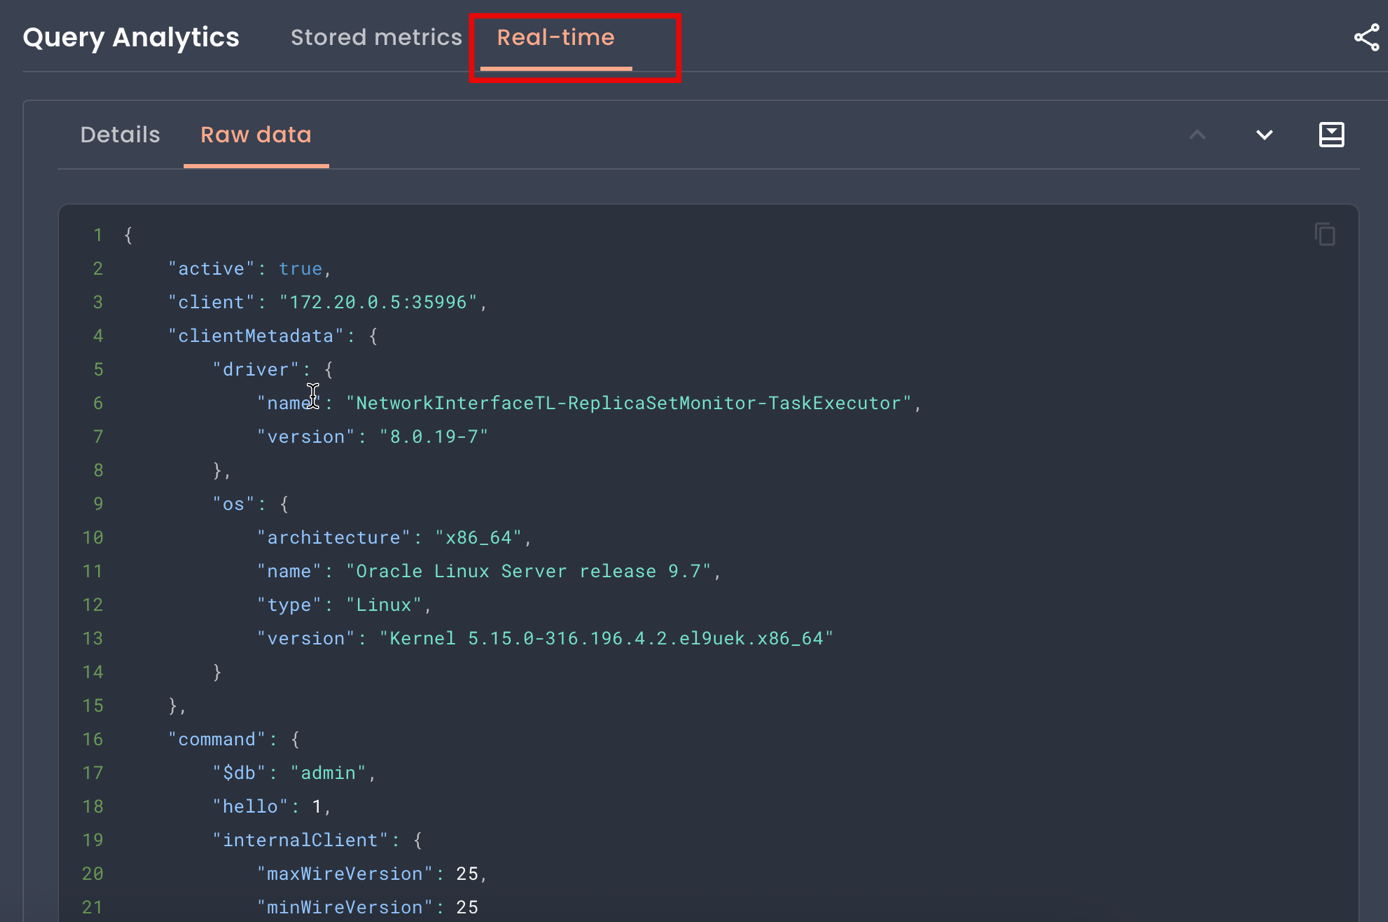
For the complete diagnostic information from MongoDB’s currentOp command, click the Raw data tab. The raw data also includes additional information not shown in the Details tab, such as driver version, platform details, and the full command structure. This can help identify issues caused by outdated drivers or specific client configurations.
Privacy considerations
Sensitive data may be visible
RTA displays raw query data from MongoDB, which may include:
- filter criteria and update values containing sensitive information
- user credentials passed in queries
- personal or confidential data used in query conditions
This data is visible to any PMM user who can access the QAN Real-time page. Consider your security requirements before enabling RTA in production environments.
RTA displays exactly what MongoDB returns and does not expose any additional information beyond what db.currentOp() provides.
Troubleshooting
No data appears
In PMM Inventory > Services, verify the RTA agent is running and the session shows Running status. Make sure your database has active queries since RTA won’t display operations that finish between collection intervals.
Some fields show “Unavailable”
Not all operations have all fields. For example, a hello command (like a ping) won’t have a Collection, User name, or Plan summary.
The query text looks different from what I sent
MongoDB’s currentOp() doesn’t return the original query text. RTA reconstructs it from the command structure, which may look different from your original query.
Check the Raw data tab to see exactly what MongoDB returned.
Session won’t start
Check the following requirements:
- PMM Client version: 3.7.0 or later. Run
pmm-admin statuson the monitored host to check. - MongoDB exporter: Must be configured and running. Go to PMM Inventory > Services, select your MongoDB service, and check that the MongoDB exporter shows Running.
- Admin role: Only users with the Admin role can start or stop sessions. Users with other roles can view live data from running sessions.