Percona Monitoring and Management 3.7.0
Release date:
Percona Monitoring and Management (PMM) is an open source database monitoring, management, and observability solution for MySQL, PostgreSQL, MongoDB, Valkey and Redis. PMM empowers you to:
- monitor the health and performance of your database systems
- identify patterns and trends in database behavior
- diagnose and resolve issues faster with actionable insights
- manage databases across on-premises, cloud, and hybrid environments
📋 Release summary
✨ Release highlights
Real-time Query Analytics (RTA) for MongoDB
MongoDB only
RTA currently supports MongoDB only. Support for MySQL and PostgreSQL is planned for future releases.
PMM 3.7.0 introduces RTA, a new way to see exactly what’s happening on your databases right now.
While Query Analytics (QAN) stores queries after they complete for performance review and optimization, RTA shows queries as they execute. This means that when your database is struggling, you can immediately see what’s causing the problem.
With a live stream updated every 1-5 seconds, RTA lets you spot long-running queries, identify lock contention, and investigate problematic operations as they happen. You can pause the stream, filter by cluster or service, and access raw MongoDB diagnostics for deeper troubleshooting.
To get started, go to Query Analytics > Real-Time and select a MongoDB service:
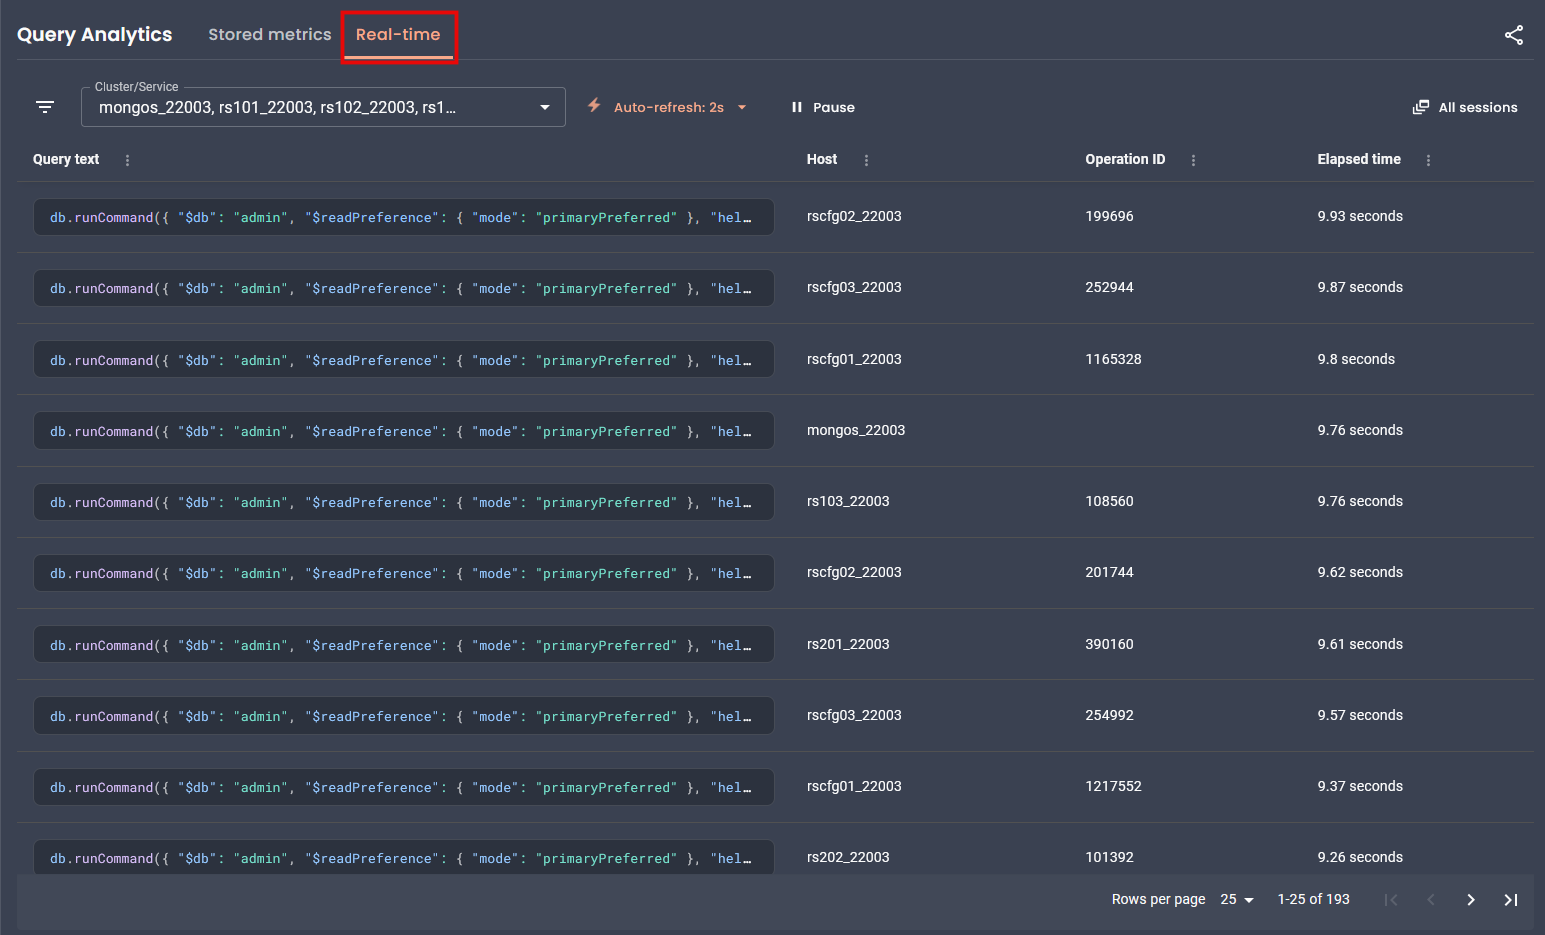
To learn how to work with RTA, see Real-time Query Analytics.
For programmatic access, see the Real-time Analytics API.
Percona Platform connectivity removed
As announced in PMM 3.5.0, Percona Platform services are now discontinued.
With PMM 3.7.0, there’s no longer any connection to Percona Platform in the UI or API. Since your advisors and alert templates now ship directly with PMM, everything will continue working exactly as before, you just won’t see any Platform-related options anymore.
This also means you can no longer sign into PMM using your Percona Account. If you used this login method, switch to a different authentication method such as basic auth, LDAP, OAuth, or SAML.
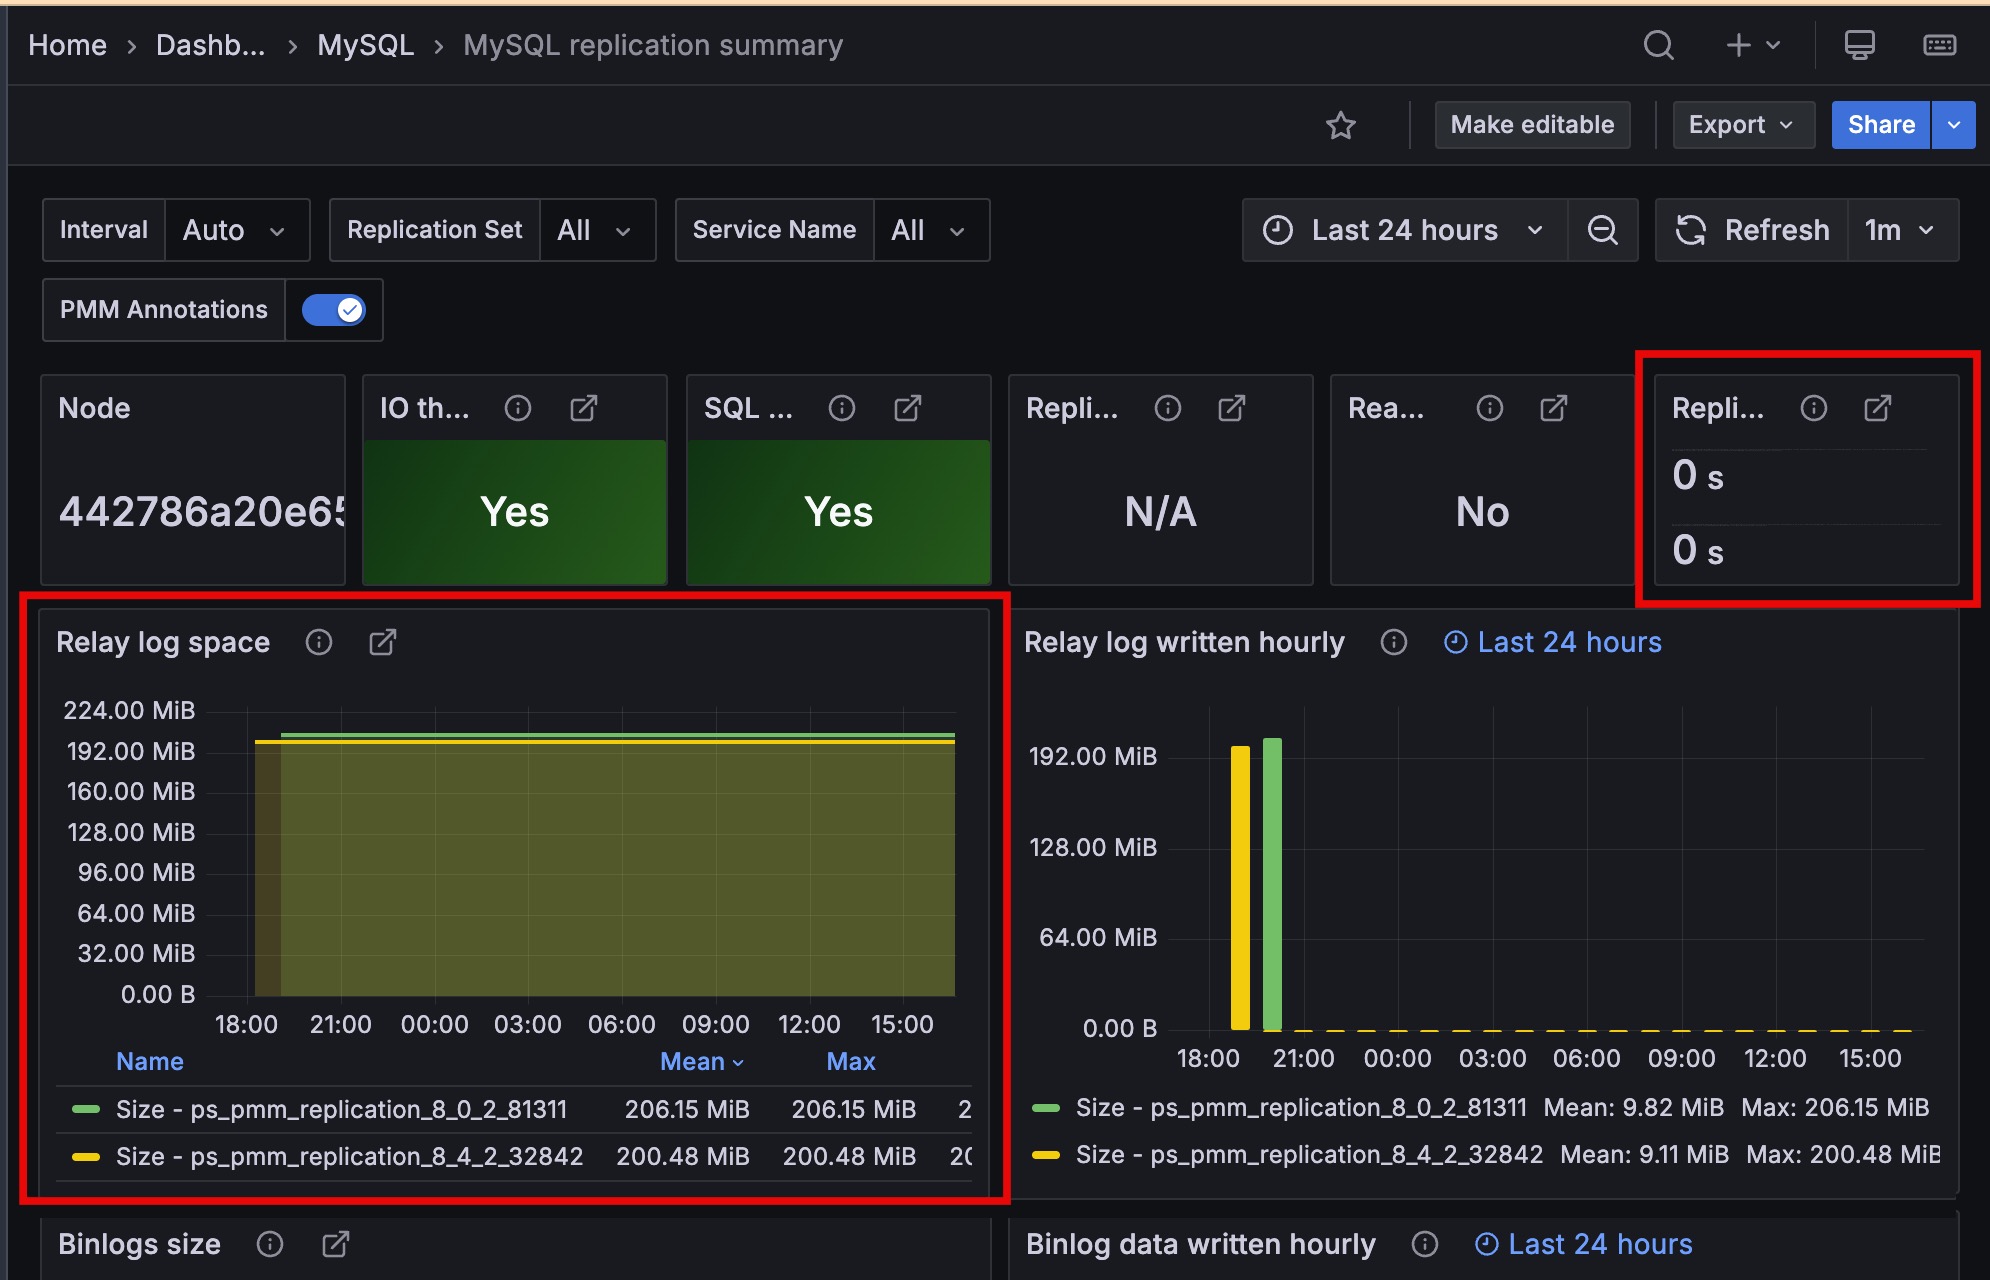
Improved MySQL Replication Summary dashboard
The Replication Delay and Relay Log Space panels now display time series with unique colors and include service names in the legend, making it easier to monitor multi-source replication setups.
Encrypt the PMM Client configuration file
You can now encrypt the PMM Client configuration file (pmm-agent.yaml) to protect sensitive credentials like server passwords and API tokens on disk.
To enable encryption, generate an RSA private key and pass it to PMM Client during setup. PMM Client then handles encryption and decryption automatically. Existing deployments without an encryption key continue to work as before.
For setup instructions, see PMM Client configuration file encryption.
📦 Components upgrade
VictoriaMetrics
- PMM-14800: Upgraded VictoriaMetrics from v1.114.0 to v1.134.0. This version adds per-partition index support for improved query performance along with upstream improvements and fixes.
Grafana
- PMM-14829: Upgraded Grafana to 11.6.13 to address security vulnerabilities.
Nomad
- PMM-14829: Upgraded Nomad to 1.11.2 to address security vulnerabilities.
🔒 Security updates
📈 Improvements
-
PMM-13788: Added optional encryption for the PMM Client configuration file (
pmm-agent.yaml) to protect stored credentials and API tokens. See Encrypt the PMM Client configuration file. -
PMM-14722: Added a low-memory ClickHouse configuration for PMM Server environments with less than 16 GB RAM. If you see “memory limit exceeded” errors in ClickHouse logs or experience performance issues when working with QAN, you can switch to the optimized configuration using the
switch-config.shscript. See ClickHouse memory issues for details. -
PMM-14818: Improved performance for PostgreSQL instances with many databases (multitenant designs). The
pg_custom_database_size_customquery now runs at low resolution (60 seconds by default) instead of high resolution (5 seconds). This significantly reduces CPU usage on servers with hundreds of databases. -
PMM-14363: Mountpoint on the Disk Details dashboard are now shown in gigabytes (GB) instead of bytes, making it easier for you to read and interpret large values.
- PMM-759: Improved the Replication Delay and Relay Log Space panels on the MySQL Replication Summary dashboard.
-
PMM-14700: Advisor checks now only run for database types present in your inventory. Previously, all checks executed regardless of your actual setup. For example, MongoDB checks no longer run if you only had PostgreSQL services configured. This keeps your results focused and reduces resource usage.
-
PMM-14824: Removed the
/v1/platform:connectAPI endpoint as part of the Percona Platform sunset. Requests to this endpoint now return 404. -
PMM-14899: Advisors and alert templates no longer require telemetry to be enabled. These are now bundled with PMM, so they work even when telemetry is disabled. The Advisors toggle has also moved to the Execution intervals section in Advanced Settings.
✅ Fixed issues
-
PMM-14267: PMM would stop collecting RDS metrics after restarting
pmm-agent. Restarting the agent no longer interrupts metrics collection. -
PMM-14376: Fixed alerts continuing to fire after removing a service or node from PMM inventory. Alerts now correctly check inventory before triggering, preventing false positives.
-
[PMM-14790]: Fixed MongoDB Replset Summary dashboard so that the Operation Latencies, Query Efficiency, Queued Operations, Read & Writes, and Average Connections panels now show data broken down by service name when All is selected.
-
PMM-9602: Fixed
runtime_mysql_serverscollection errors when monitoring ProxySQL with a non-admin user. PMM now skips runtime server metrics collection when the user lacks the required permissions. -
PMM-14549: Fixed several panels on the MySQL MyRocks Details dashboard that were missing labels identifying each metric series.
-
PMM-14822: Fixed navigation issues that occurred when Grafana anonymous access (
auth.anonymousingrafana.ini) was enabled, including missing menu items and search bar inconsistencies. -
PMM-14686: PMM would return a 404 error when accessing
/debug/pprof/endpoints inmysqld_exporter. This is now fixed, and you can now collect performance profiling data from exporters for debugging. See Exporter issues for details. -
PMM-14874: Fixed external links on several dashboards (Valkey Overview, MySQL Query Response Time Details, MySQL Table Details, MySQL User Details, and Experimental dashboards) that previously showed blank pages instead of opening the intended URL.